uromeinke, FEJ. and Ghoulish Delight RULE!!! NA abides.
uromeinke, FEJ. and Ghoulish Delight RULE!!! NA abides. |
 08-24-2006, 09:19 AM
|
#31 | |
|
.
Join Date: Feb 2005
Posts: 13,354
  |
Quote:
 So, the real question is what should we expect to happen with that big spike in the green line right at the end of the graph. There is no question that current levels of CO2 are much higher than at any time in the past 400,000 years. There is no question that this is mostly anthrogenic. Where therre is a question is what will happen in response. Perhaps there is some holistic breaking system that will prevent temperature from snapping as far as CO2 levels otherwise indicate. Perhaps while CO2 and temperature are correlated there is not a causal relationship (though the theory on the causal relationship is pretty well grounded). But if there is a causal relationship between CO2 levels and mean global temperature and there is not systemic breaking mechanism on temperature are we willing to experience the consequences? That is the fundamental question of the anti-global warming crowd. The outcome is not certain, but are we really willing to risk it? Considering that we've essentially deforested continents, we've killed off global fisheries, we've drained bodies of water almost as big as the Great Lakes, I have no problem with the idea that we've altered the global atmosphere. It really isn't all that big. |
|

|
Submit to Quotes

|
|
08-24-2006, 11:23 AM
|
#32 |
|
Go Hawks Go!
Join Date: Jan 2005
Location: Parkrose
Posts: 2,632
|
Any chance we could see that graph with Margins of Error included?
__________________
River Guardian-less |
|
|
Submit to Quotes
|
|
08-24-2006, 11:31 AM
|
#33 | |
|
Senior Member
Join Date: Jan 2005
Location: East Bay Area, CA
Posts: 3,156
|
Quote:
|
|
|
|
Submit to Quotes
|
|
08-24-2006, 11:38 AM
|
#34 |
|
.
Join Date: Feb 2005
Posts: 13,354
|
I'm sure it is, though I haven't the time to do it. All the raw data is available from NOAA. However, so long as the margin of error is consistent across the time period it wouldn't change the correlation.
|
|
|
Submit to Quotes
|
|
08-24-2006, 06:49 PM
|
#35 |
|
Senior Member

Join Date: May 2005
Posts: 481
|
Does anyone mind (not LOTers, the general press) if we wait until AFTER hurricane season to say this is a 'below average' one!?
I'm not worried too much about Debby - It's "Tropical Depression 5" that I'm watching! (5 day cone pointed right between the Yucatan Peninsula and Cuba!) |
|
|
Submit to Quotes
|
|
08-24-2006, 08:42 PM
|
#36 |
|
Go Hawks Go!
Join Date: Jan 2005
Location: Parkrose
Posts: 2,632
|
Move back to Portland where all you have to worry about is Volcanoes

__________________
River Guardian-less |
|
|
Submit to Quotes
|
|
09-06-2006, 12:06 PM
|
#37 | |
|
Member
Join Date: Aug 2006
Posts: 63
|
Quote:
 This is a UN chart, but the grey areas represent margin of error. Note the smaller (although stil existent) margin of error in the later data, which is direct measurement from Mauna Kea of Carbon Dioxide. In this graph, the yellow represents the margin of error: 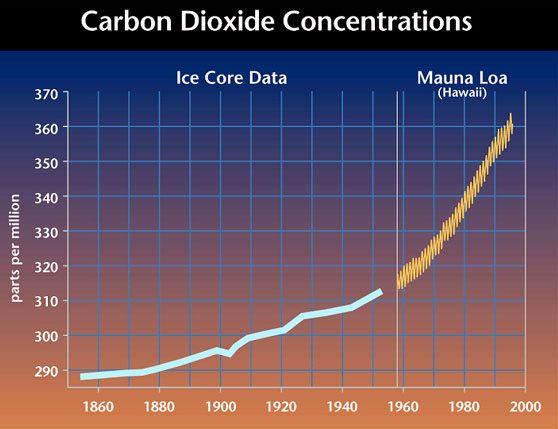 I think you're implying uncertainty here, and there's always a level of uncertainty. But you can show CO2 levels with a simple calculation. If you begin with the year 1750, generally accepted as the beginning of the Industrial Revolution, when the standard measure for CO2 levels was 278ppmv, add the known level of human-generated CO2 for that year, then subtract 2.84% of the excess CO2 because that's how fast nature tries to restore the balance. If we do this for 255 years, up to 2005, we get the pink line in the graph below. It fits the black line the actual CO2 level like a glove.  How accurate is this fit? Considering the difficulties of gathering data from centuries past, amazingly close. We know, for example, that up until 1950, deforestation was putting about as much CO2 into the atmosphere as were burning fossils, but it's not easy to know how many trees were chopped down in, say, 1850, and how much CO2 this put into the air. In spite of imperfect data, the fact that a simple calculation predicts the extraordinary shape of actual CO2 so well is clear evidence this can not be a coincidental convergence. Human CO2 emissions must have caused the upsurge is atmospheric CO2. So what? The link between human activity and rising CO2 levels is the first step. The next one is between CO2 and global warming. That was predicted over 100 years ago, but the evidence has become convincing only very recently. CO2 Level information, by the way, comes from two sources. From 1958 forward, they are from a weather station high atop the Mona Loa volcano in Hawaii. They are so accurate, they show levels going up every autumn, when the leaves fall, and coming down every spring. Earlier data are from ice cores in Antarctica. The two sources agree remarkably well. |
|
|
|
Submit to Quotes
|
|
09-06-2006, 06:41 PM
|
#38 |
|
Go Hawks Go!
Join Date: Jan 2005
Location: Parkrose
Posts: 2,632
|
Thanks for the margin of error graph, Frogberto.
__________________
River Guardian-less |
|
|
Submit to Quotes
|
|
09-08-2006, 09:05 AM
|
#39 |
|
Kink of Swank

Join Date: Jan 2005
Location: Inner Space
Posts: 13,075
   |
And I'll bump this once more just so's everyone (heheh, especially naysayers) gets a better chance to see them.
|
|
|
Submit to Quotes
|
|
09-08-2006, 05:53 PM
|
#40 | |
|
Trying to sleep

Join Date: Jan 2005
Posts: 201
|
Quote:
Ok not to be one of those "naysayers", but I'll be one. Exactly how does one measure the amount of CO2 in 1750?  |
|
|
|
Submit to Quotes
|
 |
| Thread Tools | Search this Thread |
| Display Modes | |
|
|


 Linear Mode

